ops-watchdog
Watches a business signal. Ships a morning brief. Answers 'why did this move?' on demand.
§ 01 · What it is
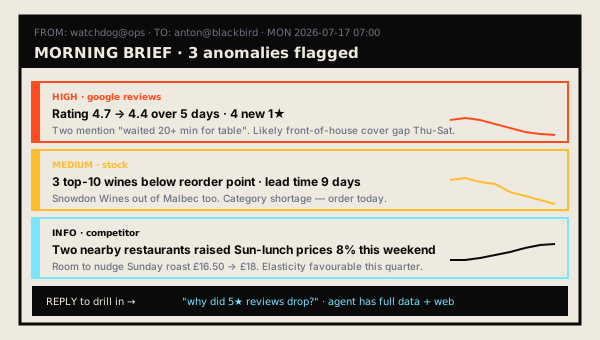
Configure it to watch a signal — stock levels, review-site rating, competitor pricing, ad spend, warehouse throughput. It records daily snapshots, detects anomalies against your baseline, and delivers a one-page morning brief. Attached is an agent that can drill into any anomaly on request: 'why did five-star reviews drop this week?' → correlated timeline + likely causes + linked source data.
§ 02 · Money it saves
§ 03 · How it works
- 01
Signal adapters ingest the raw data — Shopify inventory, Google Reviews, competitor price pages, ad platform APIs, a warehouse CSV export. Snapshotted to Postgres nightly with a small feature-engineering layer (rolling averages, deltas, seasonality baselines).
- 02
Anomaly detection runs in the morning: statistical (Z-score against rolling baseline) plus LLM-narrated ('reviews dropped from 4.7 to 4.4 over 5 days, this is a real trend not noise').
- 03
Delivers a morning brief by email or Slack: headline number, deltas, anomalies with severity, and a one-sentence recommended action per anomaly. Optimised to read in 60 seconds over coffee.
- 04
Drill-in agent: reply to the brief with a question and the agent has full access to the snapshotted data + web-search for external context ('what launched this week in our category?'). Every answer cites its data source.
Stack
§ 04 · Why it beats what's out there
General-purpose BI tools (Metabase, Looker) are excellent for people who know what question to ask. Ops managers usually don't — they need something to *tell* them what to look at today. That's the gap.
| What's out there | The gap it leaves |
|---|---|
| General-purpose BI dashboards (Metabase, Looker, Power BI) | Wait for you to open them. Assume you know what to look for. Great for scheduled reporting, bad for anomaly-first workflows. This inverts the model — it comes to you. |
| Custom analyst headcount | £45-70k/yr salary plus overhead. Vastly overkill for a 5-person e-commerce team that just needs 'tell me when something weird happens.' This covers the boring 15% of an analyst's day for the cost of a modest SaaS. |
| Alert emails from source platforms (Shopify low-stock, Google review alerts) | One channel at a time, no cross-signal correlation, no narrative. A 'low stock on SKU A' alert isn't useful without knowing 'and a competitor just went out-of-stock on the same category, so demand is about to spike'. This connects those dots. |